
BOTTOM TOPOGRAPHY FOR OCEANOGRAPHIC RESEARCH OF THE JAPAN SEA
Mikhail A. Danchenkov
Far Eastern Regional Hydrometeorological Research Institute (FERHRI), Vladivostok
Abstract: The existing views on the bottom topography of the Japan Sea have been considered. Boundaries of the basins were usually determined by boundary coordinates of a rectangle. In the article, the boundaries of the basins are determined by boundary isobaths (different ones for different basins).
Based on the GEBCO model grid data (General Bathimetric Chart of the Oceans), the schemes of bottom topography of different sea parts have been constructed. Their analysis has been carried out. The digital characteristics of the basins, troughs and main sea rises were described. Particular attention is paid to the contradictory names of the underwater relief elements. Some marine terms are explained by editors. All names in Tables and Figures and explanations below them are given in the author’s variant.
Keywords: bottom topography, Japan Sea, Tatar trough, Genzan trough, Kristofovich trough, Toyama trough, Central Basin, Yamato Basin, Tsushima Basin, Ulleung Seamount, Bersenev Seamount, Vasilkovsky Seamount, Sibir Seamount, Vityaz Rise, Bogorov Rise, Pervenets Rise
Introduction
The spatial distribution of currents and parameters of seawater is related to the peculiarities of bottom topography. Above sea mounts, on the shelf boundary, in the underwater narrowness the nature of currents, temperature and salinity fields are changing. Having studied the boundaries of rises and troughs one can make a preliminary judgment about possible meanders of currents and location of eddies. Conducting oceanographic researches you need to know the sizes of the basins and the rises, their boundary isobaths and limit depths.
The web-sites of regional institutes, Atlas of the Oceanography published by the Pacific Oceanological Institute of FEB RAS [6] and Special Encyclopedia [10] inform very little about the Japan Sea bottom topography. For instance, a reader will learn from the monograph [8] that: “According to the character of the bottom relief the Japan Sea is divided into three parts – Northern (> 44° N), Central – between 40° N and 44° N, and South (< 40° N)”.
The boundaries of the Basins are determined only by latitude without longitude. Digit data (about sills, characteristic isobaths, heights of the rises, depths of troughs, coordinates of underwater peaks and ridges) are not included.
Such information about bottom topography is useless in the oceanographic researches.
The search for missed information useful for oceanography is a goal of this article.
Data
For construction of horizontal and vertical schemes of the Japan Sea bottom relief we have used model grid data of GEBCO (General Bathymetric Chart of the Oceans) [13], restored in the British Oceanographic Data Center (Liverpool). The same information was used when we calculate the marine currents.
The similar data of the Russian Oceanographic Data Centers (RODC) or institutes is unknown to us. Of course, due to the long-term work of such Russian institutions as “Dalgeologia”, Hydrographic service of the Pacific Fleet, FEB RAS thousands of measuring stations were established. However, we (and most of users) don’t know this data.
Based on 1-minute and 5-minute grid data of GEBCO we have determined characteristics of the bottom topography main elements. They are shown below in several tables.
According to the grid data, there were constructed the bottom relief of the Japan Sea as a whole and its parts as well as depth profiles on 16 meridional and zonal sections crossing the sea. Their analysis allowed us to determine main features of the bottom topography elements: geographical boundaries (coordinates), dimensions (length and width), extreme values of depths as well as characteristic isobaths.
Analysis of the Japan Sea bottom topography
The general scheme of the Japan Sea bottom the scheme constructed according to grid data is shown on Fig.1. Usually [6,7,10] the scheme of the bottom topography is described by isobaths, multiples of 1000 m. But we have designated the boundaries of basins and troughs using more characteristic isobaths. They are different for different Basins and Troughs.
Оn Fig.1 the relief is marked by isobaths 1000, 2000, 2600, 3000, 3200, 3600 m. The dotted line shows the latitudinal boundaries of Central Basin, indicated by L.A.Zenkevich [9]. Dotted rectangles mark the boundaries of the basins from the “Gazetteer”, NOAA Reference Book of names of bottom relief features [18]. They are copied in the Russian Reference Book [1]. As we can see, the dotted rectangles (designated boundaries of the Basins) don’t coincide with isobaths. The boundaries of Tsushima Basin are not described in the “Gazetteer” – we can see there only the coordinates of its center (Fig 1 – marked with a cross).
As well, chosen in [1, 18] and marked with a cross on the Fig.1 the Basin’s center is very far (30 nautical miles) from the center, calculated according to closed isobaths.

Fig.1. Basins and main troughs of the Japan Sea
According to the features of the bottom topography, it is logical to divide the Japan Sea not into three parts (40° N and 44° N [9]), but according to the main elements of the relief. Further we will define the characteristics of the main elements of the underwater relief – basins, troughs, sea mountains, and shelf, which are important in the oceanographic researches.
In NOAA reference book of names of bottom topography features [18] and in the Dictionary of Geographical Names of Underwater Relief Forms [1] the boundaries of the Central Basin are determined only by coordinates and not by isobaths. On the Fig.1 these boundaries are shown by dotted rectangle. It can be seen that they do not correspond to any closed isobath. In other words, coordinates of basins’ boundaries in above mentioned [1,18] Reference Books are wrong. Moreover, basins’ boundaries may be better described by isobaths, and not by coordinates.
In Table 1 we have defined characteristics of basins (B) and troughs (t).
Table 1
Characteristics of Basins (b) and Troughs (t) in the Japan Sea
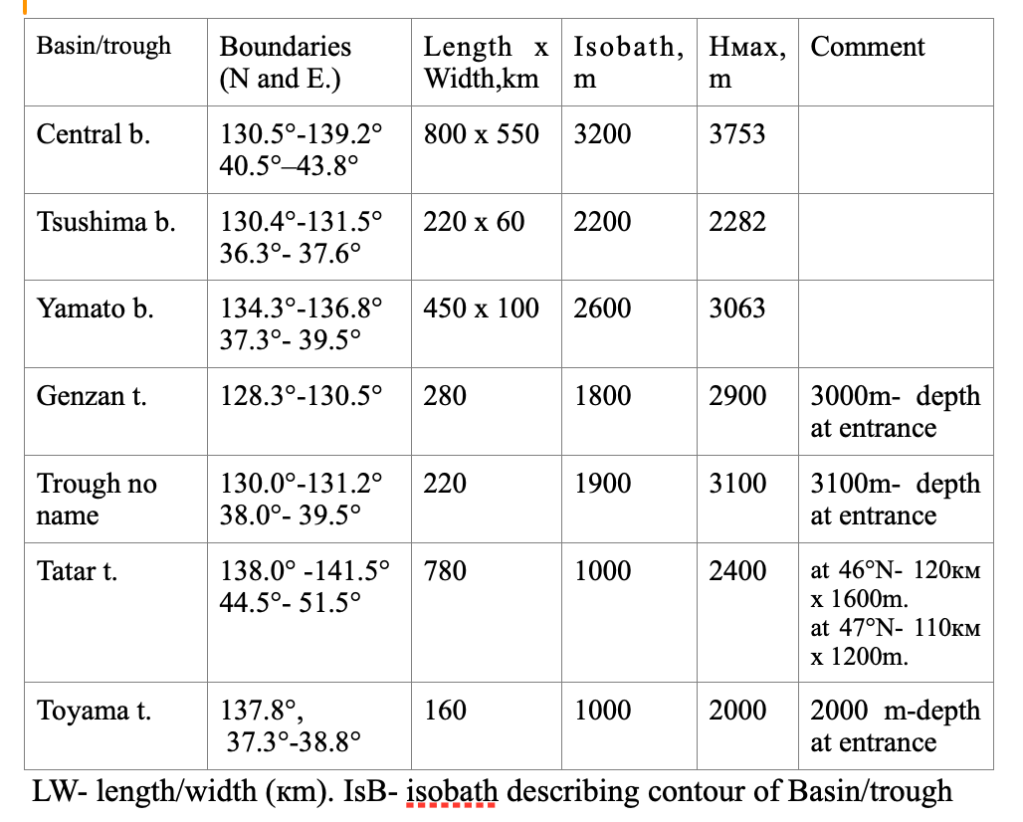
The values of the maximum depth (Нмах) were discussed in detail earlier [18]. Table 1 characteristics of Basins and troughs should be explained.
Basins
According to above mentioned explanation, Basin – a closed place where the bottom surface is lower than in other areas at least on 1000m. The Japan Sea is totally isolated from neighboring seas at the level of 150 m. At the level of 2200 m Tsushima Basin becomes isolated. Yamato Basin becomes isolated at the at the level of 2600 m. Below the level of 3200 m there is Central Basin only.
Central (Japan) Basin
Boundaries (limit latitudes and longitudes) of Central Basin (if we take into account other isobaths) are shown in the Table 2.
Table 2
Boundaries of Central Basin using various boundary isobaths

The References indicate the south limit of Central Basin at 40 N usually. But to match this latitude the boundary isobath should be at the level not 3000 m, but 3200 m.
Tsushima Basin
In Korean publications (for instance, in [11]) the boundaries of Tsushima Basin are not defined (Fig.2). At upper Fig.2 this basin is not marked at all. In the lower part of the Figure Tsushima Basin is limited by isobath 2200 m, latitude boundaries of Tsushima Basin are limited by 36.5° N и 37.5° N.
In Reference Books [1,18] the center of Tsushima Basin is located at the point with coordinates 36.5° N, 131° E. On the Fig.1 and on the Fig.2 it is designated by crosses. We can see that this position is wrong: the place of Basin’s center does not correspond with isobaths. The right coordinates of the center of Tsushima Basin are 37° N, 131° E
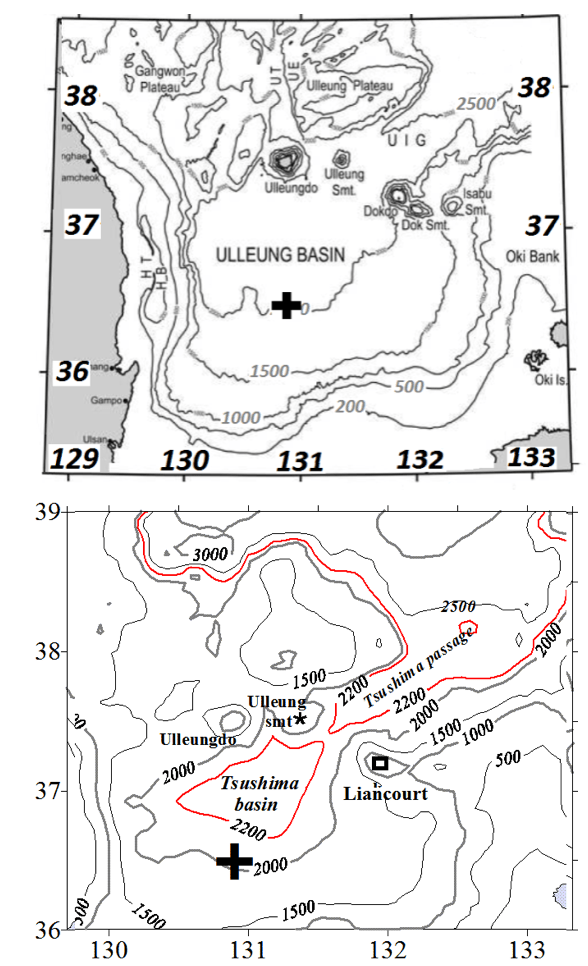
Fig. 2. Tsushima (Ulleung) Basin. Up – from the Korean monograph [11]. Down – our figure based on GEBCO data. The crosses indicate the center of the Tsushima Basin according to the coordinates given in [18]. Ulleungdo (Korean)/Matsushima (Japanese) – Dajelet Island. Ulleung smt – Ulleung mountain. Dokdo (Korean)/Takesima (Japanese) – Liancourt Islands
Deep passage UIG, connecting Central Basin and Tsushima Basin, is depicted by the same isobath (2200m) that also limits the Tsushima basin itself.
Yamato Basin
Between Yamato Rise and Honshu Island there is located the Yamato Basin. It’s latitude boundaries are 37.3° N and 39.5° N.
The boundary between it and the Central Basin is a concentration of isobaths from 2600 m to 3200 m. Its closed area is defined by the 2600 m isobath (Fig. 3).And the closed area of Yamato Basin is limited by isobath 2600 m (Fig.3). In the west the Basin is limited by the wall (1200 m – 2400 m) of southern Yamato Bank. In the east the Basin is limited by steep island slope (1000 m – 2200 m).

Fig. 3. Yamato Basin
Vertical boundary between Yamato Basin and Tsushima Basin begins at the 1100 m. In other words, water circulation in this sea area above and below the 1000 m should differ distinctly.
Bottom profile at the section along 38.5° N.
At the section (Fig.4) there are located five deep bottom depressions. Such its location allows to conclude that deep sea waters move mostly along the meridians than along the parallels.
In addition to basins the important depressions of underwater relief are: Tatar trough, Genzan trough, Unnamed trough and Toyama trough.
Genzan trough goes from Central Basin along the continental shore rather far to the west and to the south. At the end there is a vast plateau with depths more than 2000 m (Fig.5). The area’s oceanography has not been studied. We can only suppose that, in addition to the southward movement of cold waters along the shore, there should be the northward movement of warm waters along the East Korean Rise.

Fig. 4. Section across basins and troughs (at 38.5°N)

Fig. 5. Genzan trough and unnamed trough
Unnamed trough
Some Russian publications (for example, [9]) call this object as Kristofovich trough. However, other Russian and all foreign authors prefer to call it Unnamed trough and consider this name as standard due to geographic (the trough is located in North Korean economic zone) and political ((Kristofovich is a Russian geologist) circumstances. Therefore, we also think it would be logical to use “Unnamed trough”.
Tatar trough
Tatar trough has a distinct boundary with Central Basin between isobaths 2500 m and 3000 m (Fig.6) At the latitude of 44°N Central Basin narrows sharply and turns into this deep-water trough. The depth of the trough decreases as you move from south to north: from 2500 m at trough’s southern boundary to 200 m at 49.5°N and up to 160 m at 50°N.

Fig. 6. Tarar trough
The width’s and depth’s values in different values for Tatar trough are shown in the Table 1 and Fig. 7

Fig. 7. Bottom profiles at different sections across the Tartar trough
At 44°N in the middle of Tatar trough there is located underwater ridge.
The depths in Tatar trough decrease in steps as you move from south to north (at 46.5°N and at 49°N- Fig.8). In its eastern part there is a place (in the area of Kholmsk – at 47°N), where the trough comes very close to the shore of Sakhalin.

Fig. 8. Bottom profile along the Tatar trough (46° N – 52° N)
However, the simplicity of bottom profile in Tatar Strait is not apparent: 5-minute grid data don’t reflect all its peculiarities. Considering different depths a researcher may discover something new. Interestingly, that some discoveries are left without commentaries.
For example, Mogi A. [15] did not explain unusual slope spur and the closed bottom depression with the center at 47.5°N (not included in Tatar trough).
S. Prantz [5] did not explain the unknown basin with the center at 50°N (Fig.9)
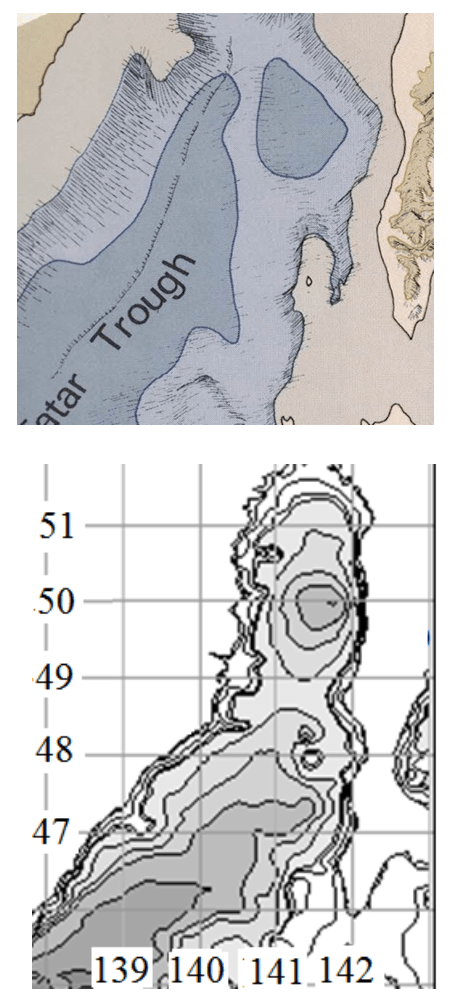
Fig. 9. Unusual elements of the bottom relief of the Tartar strait.
At the up- from [10], at the down- from [11]
Underwater ridges and mountains in the Japan Sea
We should clearly understand that in the process of researches there may appear new terms, definitions, characteristics of bottom elements. For example, instead of single mountains underwater ridges and rises appear, their coordinates, sizes and heights change. Most important oceanographic characteristics for mountains, ridges and rises are coordinates and minimum heights. They are shown in Table 3.
Table 3
Characteristics of rises, ridges and mountains of the Japan Sea
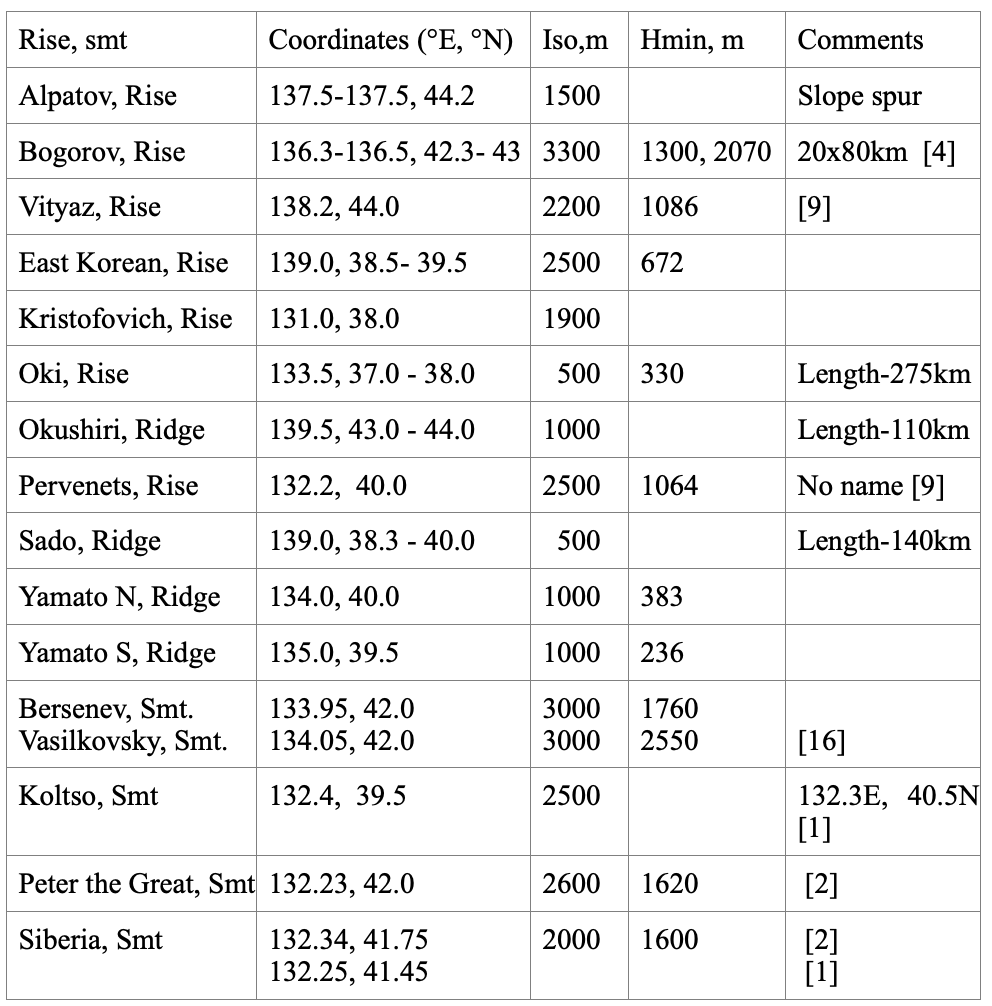
Iso – isobath, limiting the mountain/ridge/rise.
Hmin – minimum depth of the sea above the mountain/ridge/rise.
Smt- sea mountain/
Siberia Seamount is not very high (1600 m) for such a name (Siberia is the vast region of Russia). The Russians could not give this name (Siberia) to the seamount. Therefore, it was the Japanese idea. They often write the name “Siberia” on the maps with Primorye Region or Sikhote-Alin Mountains. For them all these areas are equally far and cold. But it is not clear when they studied Siberia Seamount: M.Uda had not shown it on his map [17], and after 1930s Japan researchers did not work near Vladivostok.
Bogorov Rise (Fig.10), Bersenev Seamount and Vasilkovsky Seamount [16] are paired mountains.

Fig. 10. Bogorov Rise. On the up – constructed by us from grid data.
On the down – from [4]
As research progresses the ideas about location and height of seamounts near Vladivostok changed, we can assess comparing the publications ([16] and [3]) – Fig.11.

Fig. 11. Views on the location and height of the mountains of the Pervenets Rise
Siberia seamount dropped by 200 m. The highest peak of the rise also dropped (from 1120 m to 940 m) but remained unnamed.
The Japan Sea shelf
Comparing with Bering Sea (45% of its square with the depth less than 200 m) and Sea of Okhotsk (40%) the Japan Sea shelf is not vast (only 24% of its square with the depth less than 200 m).
Unlike other seas, its shelf is not a single whole. In the Bering Sea the shelf occupies the northeastern half of the sea, in the Sea of Okhotsk – the northwestern half. As for the Sea of Japan, vast areas of the shelf are located in the Tatar Strait, near the La Perouse Strait, in the Tsushima Strait (Fig.12) as well in Peter the Great Bay.
The narrowest areas with the depths less than 200 m are located along Primorye Region and along Korean Peninsula (Table 4).

Fig. 12. Shelf near the Tsushima and La Perouse straits
Table 4
Characteristics of the shelf in different places of the Japan Sea

The author thanks V.B.Lobanov for comments and constructive suggestions for improving the article.
The author is grateful to British Oceanographic Data Center (BODC) for the digital Japan Sea depth data.
REFERENCES
1. Agapova G. V., Vinogradova N. V., Kashnikova I. P. Glossary of Geographical Names of Underwater Relief Forms, M.: Geol.Inst. RAS, 1993, 311p. / Агапова Г.В., Винеоградова Н.В., Кашинкова И.П. Словарь географических названий форм подводного рельефа, М., Институт геологии РАН, 1993, 311 с. 2. Karnaukh V. N., Karp B. Ya., Tsoi I. B. Seismostratigraphy of the sedimentary cover and sedimentation processes on the Pervenets Rise and in its vicinity (the Japan Sea), Marine Geology, 2004, Vol.44, №6, pp.1-14 / Карнаух В.Н., Карп В.Я, Цой И.В.. Сейсмостратиграфия осадочного чехла и процессов седиментации на возвышенности Первенца и в ее окрестностях (Японское море), «Морская геология», 2004, том 44, №6, с.1-14.
3. Karnaukh V.N., Koptev A.A., Sukhoveev E.N., Matyukhov V.P., Aparina K.A. Relief of the Pervenets underwater rise (Sea of Japan), “Geomorphology”, 2020, № 2, pp.50-59 / Карнаух В.Н., Коптев А.А., Суховеев E Н., Матюхов В.П., Апарина К.А., Рельеф подводной возвышенности Первенца (Японское море), «Геоморфология», 2020, №2, с. 50-59. 4. Karnaukh V.N., Tsoi I.B. Seismic stratigraphy and conditions of sedimentary cover formation in the Sea of Japan in the Bogorov Rise area, “Marine Geology”, 2010, vol.50, № 4, pp. 590–607
5. Prantz S. V., Ponomarev V. I., Budyansky M. V., Uleysky M. Yu., Faiman P. A. Lagrangian analysis of water mixing and transport in sea bays, Bulletin of the Russian Academy of Sciences, FAO series, 2013, vol. 49, № 1, p. 91-106. 6. Rostov I. D., Yurasov G. I., Rudykh N. I., Moroz V. V., Dmitrieva E. V., Rostov V. I., Nabiullin A. A., Khrapchenkov F. F., Bunin V. M. CD Atlas of the oceanography of the Bering Sea, Sea of Okhotsk and Sea of Japan, TOI FEB RAS, Vladivostok, 2005 / Ростов И.Д., Юрасов Г.И., Рудик H.И, Мороз В.В., Дмитриева Е.В., Ростов В.И., Набиулин А.А., Храпчеков Ф.Ф., Бунин В.М. CD Атлас океанографии Берингова моря, Охотского моря, Японского моря, ТОИ ДВО РАН, Владивосток, 2005.
7. Tsoi I. B., Karnaukh V. N., Lelikov E. P. Names of underwater morphostructures of the Japan Sea – history and modern problems, Oceanology, 2013, № 6, p. 800-812 / Цой И.В., Карнаух В.Н., Леликов Е.П. Названия подводных морфоструктур в Японском море – история и современные проблемы, «Океанология», 2013, №6, с. 800 – 812 8. Yurasov G.I., Yarichin V.G. Currents of the Japan Sea, Vladivostok: Far Eastern.branch, USSR Academy of Sciences, 1991, 176 p. / Юрасов Г.И., Яричин В.Г., Течения Японского моря, Владивосток, ДВО РАН, 1991, 176 с. 9. Zenkevich N. L. Bottom Relief /Main Features of Geology and Hydrology of the Japan Sea, M.: Publishing House of the USSR Ac. Sci., 1961, p. 5–22 / Зенкевич Н.Л. Рельеф дна/Основные характеристики геологии и гидрологии Японского моря, М., Издательство АН СССР, 1961, с. 5-22. 10. Zonn I. S., Kostyanoy A. G. The Japan Sea/Encyclopedia, Moscow, “International .Relations”, 2009, 421 p. / Зонн И.С., Костяной А.Г., Японское море/Энциклопедия, Москва, «международные отношения», 2009, 421 сс. 11. Chang K.I, Zhang C.I., Park C., Kang D.J.,<Ju S.J., Lee S.H. Oceanography of the East Sea (Japan Sea), 2016, 460 pp. 12. Danchenkov M.A. Maximum depth of the Sea of Japan, Asia-Pacific Journal of Marine Science and Education, 2019, v.9, № 2, p.18-27 13. GEBCO, British Oceanographic Data Center https://gebco.net 14. International Conference on the Sea of Japan, Edited . Valencia M.J. Honolulu, East-West Center Press, 1989, 239 pp. 15. Mogi A. An Atlas of the Sea flour around Japan. Aspects of submarine geomorphology, Tokyo: Tokyo University Press, 1979, 96 pp. 16. Tsoy I.B., Karnaukh V.N., Lelikov Ye.P. Undersea features of the NW Japan/East sea floor and an implication of their nomenclature, The 2nd International Symposium. on application of marine geophysical data and undersea features, October 17-19, 2007, Korea, Incheon, 2007, p. 82-100
17. Uda M. The results of simultaneous oceanographic investigations in the Japan Sea and its adjacent waters in May and June 1932, J.Imp.Fish.Exp.Station, 1934. v.5, p.57-190
18. The gazetteer. NOAA reference book of names of bottom relief features. https://www.ngdc.noaa.gov/gazetteer
